How Analytics Can Enhance Fundraising
- Catalyst
- Mar 4, 2015
- 3 min read

Presentation to
thankQ User Group Forum
Wednesday 4 March 2015
Lawrence Jackson
Professor Ujwal Kayande

John Wanamaker’s famous last words on advertising …
John Wanamaker, US Department Store
Proprietor. 1838-1922
Half the money I spend on advertising is wasted. The trouble is I don't know which half. I spend $2 million on advertising each year and I don’t know if that is half enough or twice too much.
THE VALUE OF ANALYTICS
How Obama used micro-segmentation to target swing voters

The problem
Voters do not wear uniforms! Most elections are won by a few percentage points only. How to identify potential swing voters, and target them with the “right” message?
Step 1
Deep needs survey
• Large survey in the US
3,000 respondents
• 140 questions about deep needs, beliefs and values
What do you envision for the future? (fear, hopes, safety, etc.)
How do you define success? (family, financial security, community respect, business success)
Skills and assets you believe you will need to achieve success?
“Taking care of the country’s children should be our #1 priority”
“Country should do whatever it takes to protect the environment”
Etc.
• Which party they voted for in the last elections
Step 2
Need-based segmentation
• Found 5 segments
“Extending opportunities to others” (37%)
“Working within the community”
“Achieving independence”
“Focusing on family”
“Defending righteousness” (16%)
• Further segmented into 10 “tribes”
Step 3
Focusing on swing voters
• “Extending opportunities to others”
Keyword for Democrats. No need to “convince” them
• “Defending righteousness”
Pure-blood Republicans. Don’t bother
• Potential swing voters:
“Working within the community”
“Achieving independence”
“Focusing on family”
Step 4
Discriminant analysis
• Bought discriminant data (descriptors) from various commercial database companies
• ChoicePoint
Tax records, court rulings, birth and death records
Used for checking resumes, loan, credit card, etc.
• Acxiom
Shopping and lifestyle data on 200,000,000 Americans
Value of their house, magazines subscribed, books bought, etc.
Then used this data to predict segment memberships
• You are more likely to be a hard core Democrat if…
You have a cat
You eat sushis
You have an Apple computer
…
• You are more likely to be a hard core Republican if…
You have a dog
You drive a Pontiac
You own a gun
You go to church
…
Step 5
Targeting
Suppose you have a tight race in the eastern district of North Carolina
Go to Acxiom
Buy addresses of 20,000 people in that region who are likely to belong to the “Working within the community” segment
Send a specific direct mail talking about the Democrat promise to help local groups working with the community
Or…
Check what TV programs the “Focusing on family” segment members watch, and when, in that region (e.g., games, TV shows)
Buy TV spots during these programs
Advertise plans for children’s education, family welfare…
Did it work?

Of course..…
How scoring can be used in direct marketing fundraising
Key figures
A large charity sends a direct mail solicitation to its donors for its Christmas campaign
A few key figures:

Scoring model
They used several choice models (scoring)
• Responses:
Likelihood of donation
Donation amount
• Predictors:
Recency
Frequency
Amount
Activity over the years
Demographics
…
• They built a score…
Score = Likelihood of donation x Donation amount
• And ranked all their donors in decreasing order
Managerial question
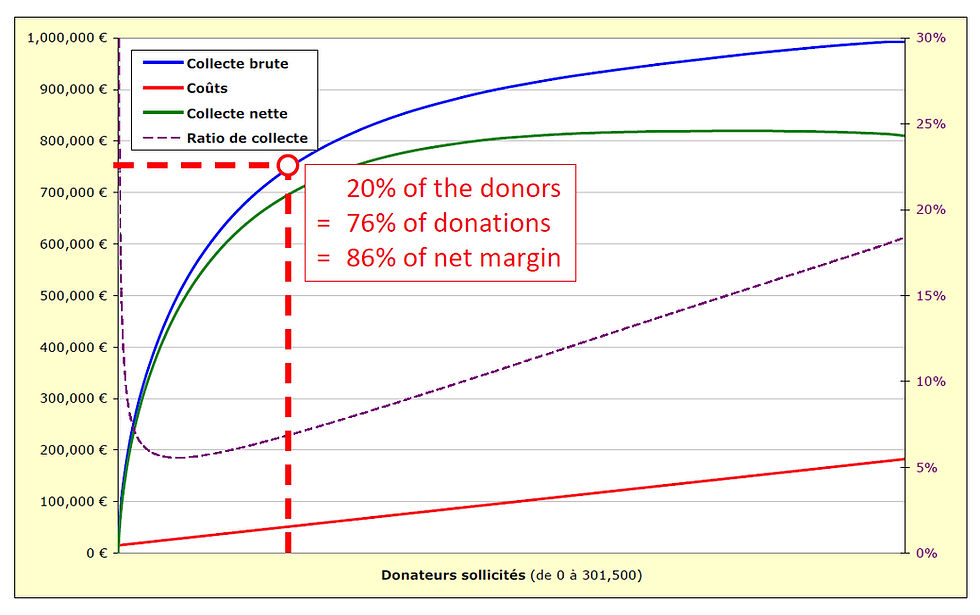
What would have been the financial results, had we only solicited the top [X]% of our donors? (e.g., the 10% of our donors who received the highest scores, the top-50%, etc.)
Financial results


Impact of Analytics
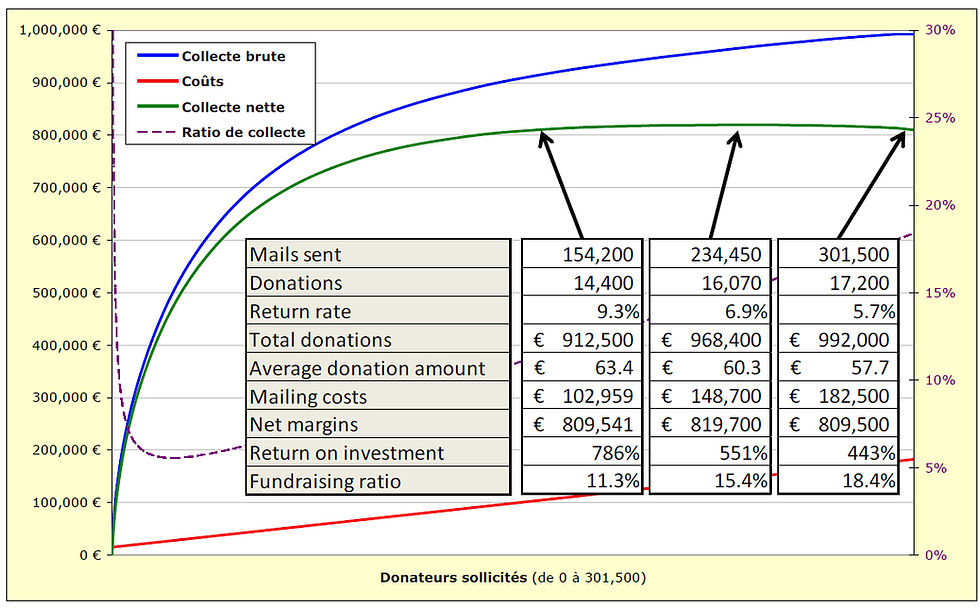
Depending on the managerial objectives, this charity could:
• Collect more with less
+ 10,000 €
Improve fundraising ratio from 18.4% to 15.4%
• Dramatically improve financial performance
Same net margins
Improve fundraising ratio from 18.4% to 11.3%
Improve ROI almost twofold
Save 80,000 € in costs
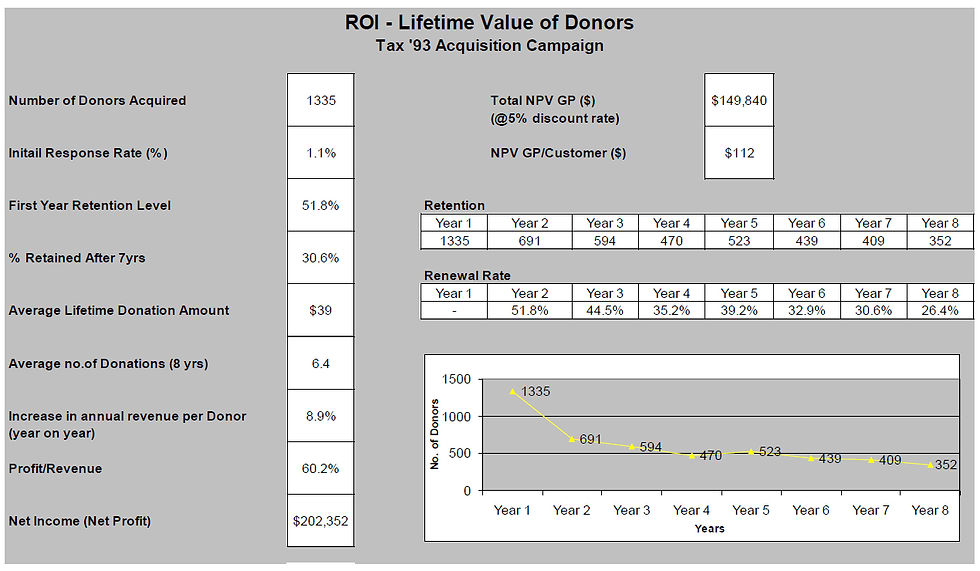
Case Study Lifetime Value of the Donor


Key findings: RBS project

All campaigns showed positive net income over long term, broke even with 12-36 months of initial mailing and were NPV positive.
Further, IRR rates were between 25 % - 63 % and significantly higher than the returns RBS receives from its financial investments.
Return on Investment (ROI) and Internal Rate of Returns (IRR)

Key insights from this analysis
Our fundraising was highly profitable but only when viewed / measured over the long term
Same campaign clearly worked better than other but all were highly profitable
We appeared to be under investing based on the market potential at the time
We were leaving “money on the table”
Critical questions for your charity / fundraising program
What returns are you currently receiving from your fundraising?
What techniques methods are working best / worse for you?
Is your charity “leaving money on the table”?
How much should you invest in fundraising?
What is the optimal amount to invest ?
Closing thoughts ...

“In God we trust. Everyone else, must bring data”
“Without data you are just another person with an opinion”
– J Edward Deming
thankQ / Catalyst Management Fundraising Analytics Program: Jason Haigh
Specifically tailored for fundraising context
Objective: use metrics and analytics to enhance fundraising performance
The thankQ/Catalyst Management solution
Workshops
Data analysis
Affinity and moves management within ThankQ
Bottom line: a substantial improvement in your fundraising
If you are interested in finding out more, please contact Jackie Gold:
email: Jackie.Gold@thankq.com.au

Lawrence Jackson
Director
Level 15, 9 Hunter St, Sydney
NSW 2029 Australia
Mobile: 0438 602 357
Tel (02) 9262 4933
Fax (02) 9262 1619
ljackson@catalystmanagement.com.au


Comentários